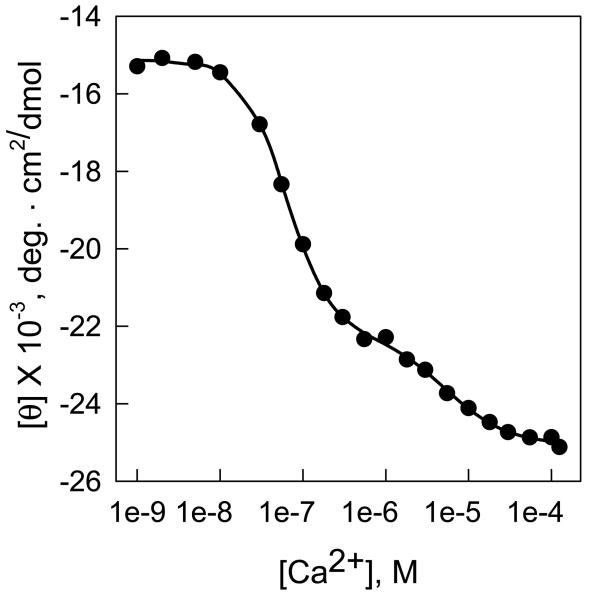
Figure 3. Determination of affinity constants from changes in the intrinsic CD of the polypeptide backbone as a function of increasing ligand concentration.
0.4 ml of chicken muscle Troponin C (TnC), 0.1 mg/ml, in 100 mM KCl, 50 mM Tris-HCl, pH 7.5, 0.9 mM EGTA, 0.9 mM nitriloacetic acid, pH 7.5 at 25 °C, in a 0.2 ml cuvette was titrated with Ca2+.

