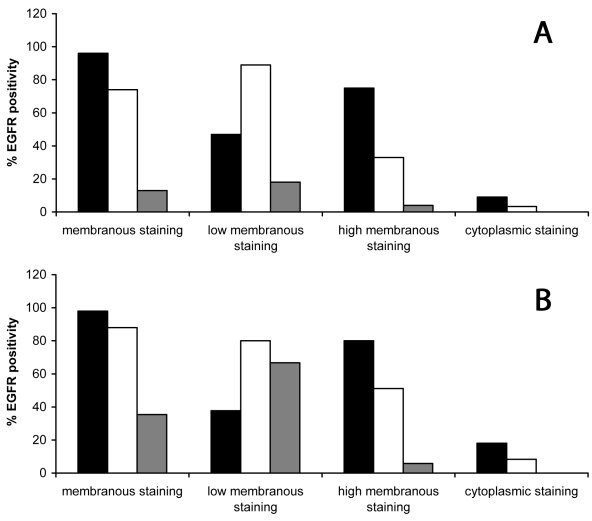
Figure 3.
(A) Percentages of membranous (low and/or high) and cytoplasmic positive cells for epidermal growth factor receptor (EGFR) in abnormal and (B) atypical hyperplastic lesions. Hyperplastic lesions had more positive suprabasal cells than the control group (P = 0.001; Mann-Whitney U-test). Within this group, a gradual change in membranous staining was noted, from weak positive in abnormal hyperplasia to strong positive in atypical lesions. The differences were most striking in the suprabasal-transforming zone. Superficial layers showed mainly low membranous staining and only a small number of cells manifested high staining intensity. Cytoplasmic staining was mostly basal and suprabasal, stronger than in the control group (basal layer P < 0.001; suprabasal layer P < 0.001; Mann-Whitney U-test) but weaker than in cancerous lesions group (basal layer P < 0.001; suprabasal layer P < 0.001; Mann-Whitney U-test). Closed bars – basal layer; open bars – suprabasal layer; and gray bars – superficial layer.

