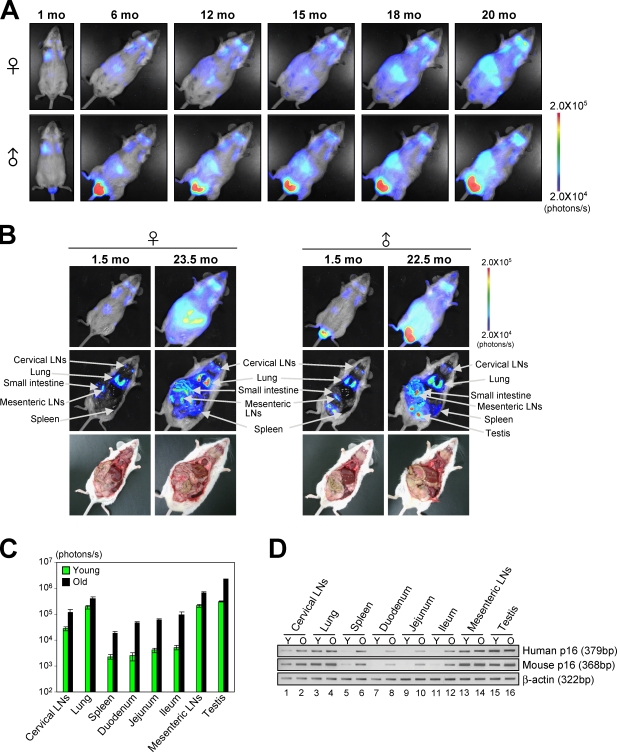
Figure 3.
The dynamics of p16Ink4a gene expression during the aging process in vivo. (A) The same p16-luc mice were subjected to noninvasive BLI every 2 wk throughout their entire life span. Representative images of 10 independent mice are shown. (B) The p16-luc mice (young and old) were subjected to noninvasive BLI. The same mice were then incised through mouth and anus under anesthesia. (A and B) The color bars indicate photons with minimum and maximum threshold values. (C) Bioluminescence intensity emitted from the organs from young (1.5 mo) and old (22.5 mo) mice were graphed (log10 scale). The mean ± SD of five independent experiments is shown. (D) The levels of exogenous (human) p16Ink4a gene expression and endogenous (mouse) p16Ink4a gene expression from young (Y; 1.5 mo) and old (O; 22.5 mo) mice were analyzed by semiquantitative RT-PCR. β-Actin was used as a loading control. Representative data of five independent experiments are shown.

