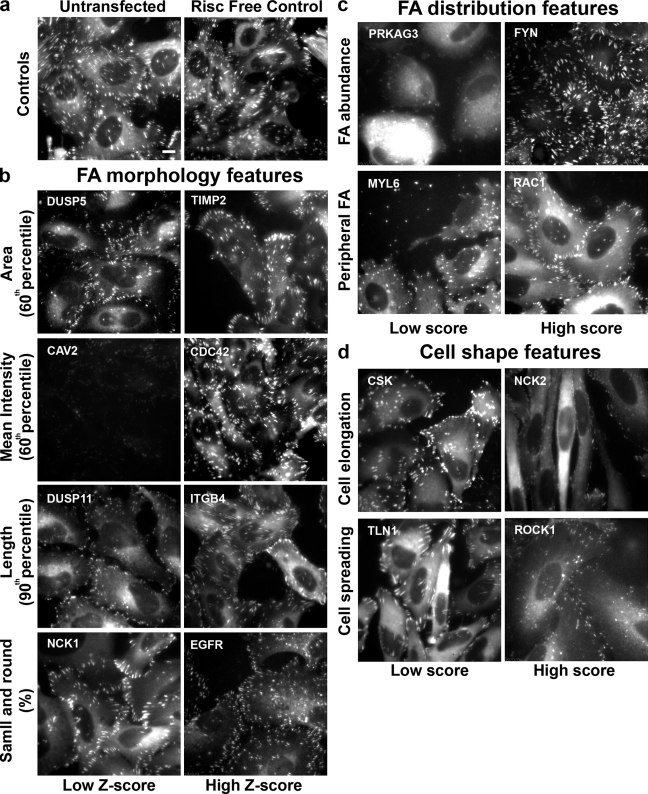
Figure 2.
Summary of the effects of siRNAs on the analyzed features. Single images of representative sample wells, showing significantly high or low z scores in FA morphological features or significantly high or low manual scores in FA distribution or cell shape features. The images in the “Low Z-score” or “Low score” columns are those with significantly low z scores or manual scores, respectively. The images in the “High Z-score” or “High score” columns are those with significantly high z scores or manual scores, respectively. (a) Untransfected and Risc-free–transfected HeLa cells expressing YFP-paxillin (controls). (b) Examples of hits that varied widely from control cells in their FA morphological features: FA area, FA intensity, FA length, and small and round FAs. (c) Examples of hits that varied significantly from control cells in FA distribution features: FA abundance, and peripheral FA. (d) Examples of hits that varied significantly from control cells in cell shape features: cell elongation and cell spreading. The siRNAs are designated by their Entrez gene symbol (National Center for Biotechnology Information). For full information concerning the hits, see Table S2. Bar (applies to all images), 10 µm.

