Figure 2.
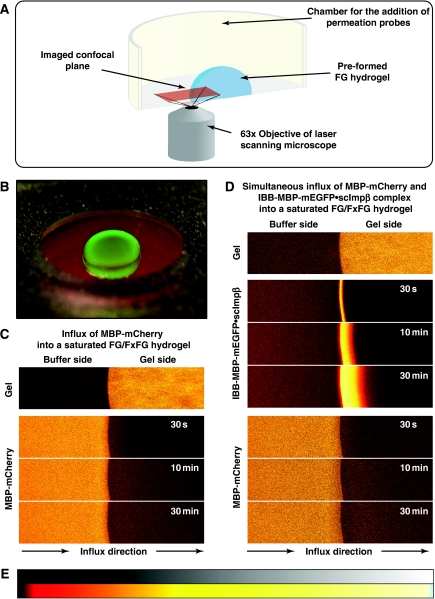
Experimental set-up for studying influx into an FG hydrogel. (A) Illustration of the experimental set-up. (B) A saturated FG/FxFG2–601Nsp1 hydrogel within the imaging chamber after completion of an influx experiment. Photographs were taken using a macro lens either under white light or UV illumination and overlaid. Note that the green NTR·cargo complex (IBB-MBP-mEGFP·scImpβ) entered the gel, whereas the red inert reference molecule (MBP-mCherry) stayed out. (C) Influx of MBP-mCherry alone into a saturated FG/FxFG2–601Nsp1 hydrogel followed by laser scanning confocal microscopy. Time elapsed after addition is indicated. Upper panels show the gel as detected by an incorporated Atto647N-labelled tracer molecule. Lower panels show 3 μM of MBP-mCherry added to the buffer side of the gel. The gel contained 200 mg/ml of FG/FxFG2–601Nsp1. For quantification see Figure 3 and Table I. For false-colour code, see panel E. (D) Experiment shows simultaneous influx of MBP-mCherry and IBB-MBP-mEGFP·scImpβ complex into the same batch of hydrogel as shown in panel C. Note that the rapid influx of the NTR·cargo complex did not detectably increase the entry of the non-receptor-bound inert reference molecule MBP-mCherry. For quantification, see Figure 3. (E) Look-up table used for translation of grey scale into false-colour images.

