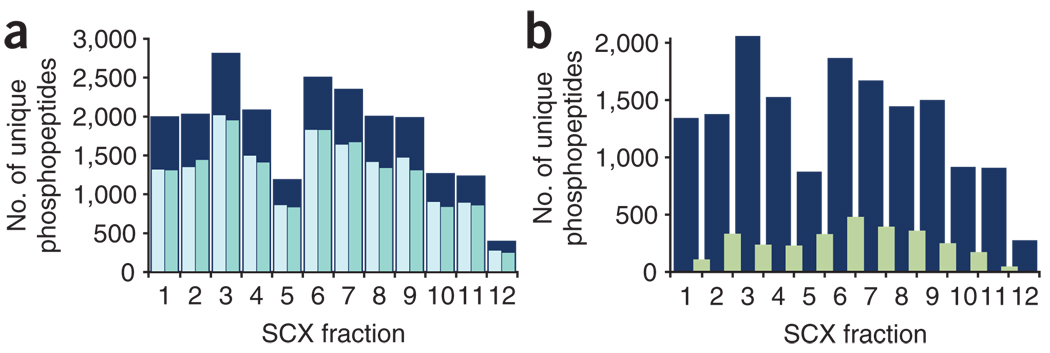
Figure 4. Phosphopeptide distributions.
(a) Duplicate analyses of each fraction (pale blue and green) significantly increases the number of unique phosphopeptides identified (dark blue). (b) Overlap between consecutive SCX fractions (green) as compared with the number of unique phosphopeptides identified from one replicate of each fraction (dark blue).

