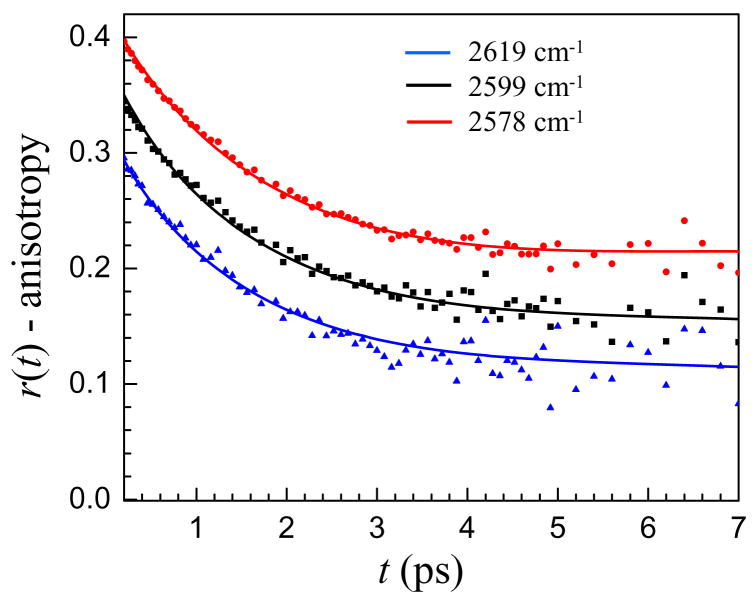
Figure 6.
Anisotropy decays and two component model fits for the w0 = 25 AOT reverse micelle. Three frequencies in the interfacial region are shown. Red circles = 2578 cm−1. Black squares = 2599 cm−1. Blue triangles = 2619 cm−1. The top and bottom data and fits are offset up and down by 0.05 so that the fits can be seen clearly.

