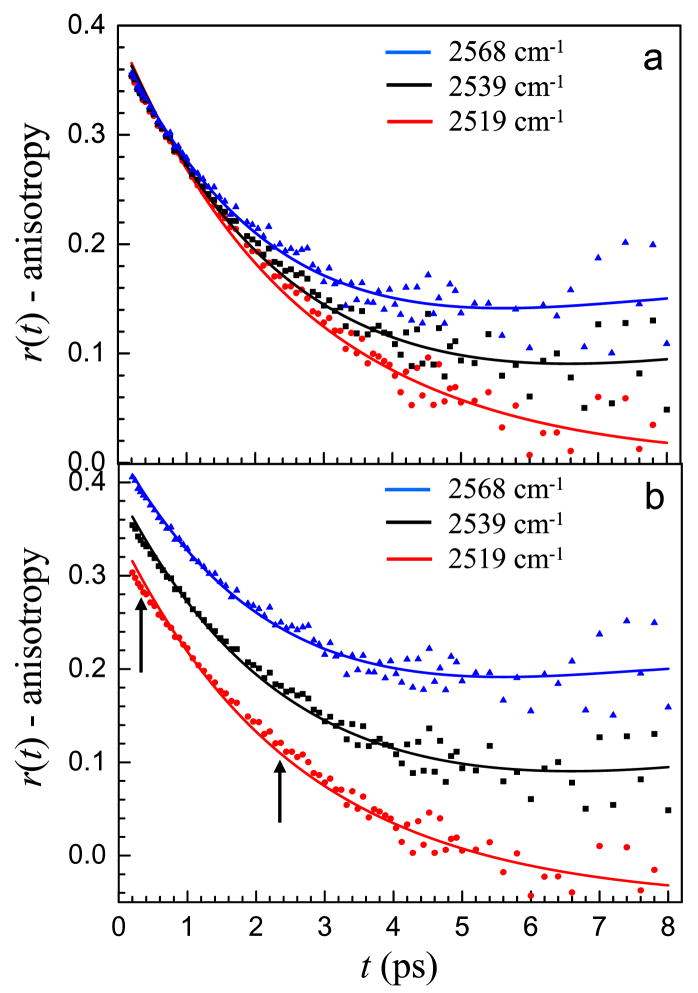
Figure 7.
Anisotropy decays and two component model fits for the w0 = 46 reverse micelle at frequencies outside of the interfacial spectral region. Red circles = 2519 cm−1. Black squares = 2539 cm−1. Blue triangles = 2568 cm−1. a. Unshifted data and fits to clearly show how the decay slows as the frequency increases. b. The top and bottom data and fits are offset up and down by 0.05 so that the results can be seen clearly. The fit is quite good at 2568 cm−1 but begins to miss at early and intermediate times at lower frequencies as marked by the arrows.

