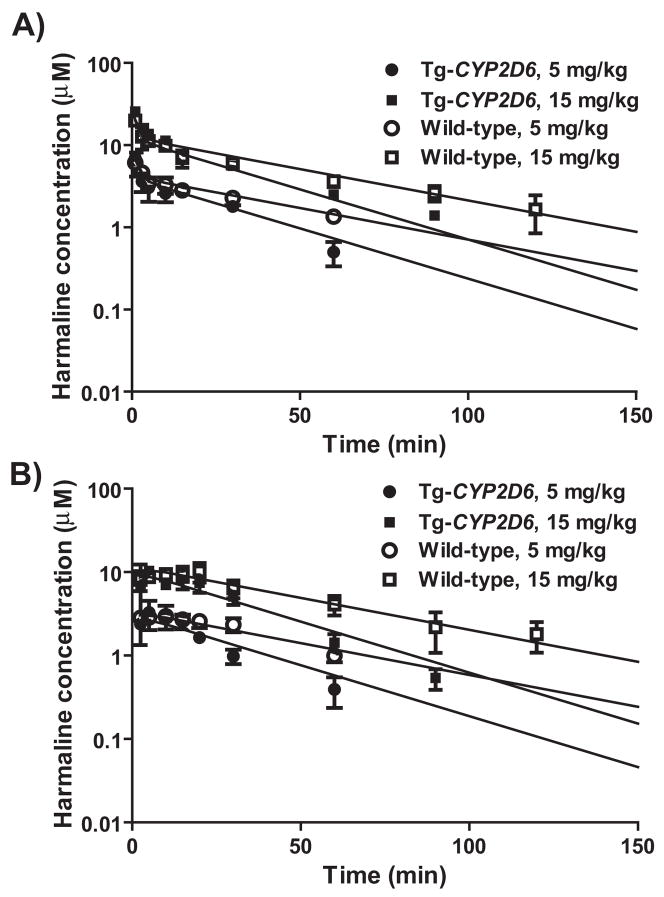
Figure 4.
Serum harmaline concentration vs. time curves in wild-type and Tg-CYP2D6 mice administered i.v. (A) or i.p. (B) with harmaline (5 and 15 mg/kg). Values represent mean ± SD (N = 3 at each time point). For each dose, significant difference in harmaline concentrations is shown for the variations of CYP2D6 genotype and time (P < 0.05; two-way ANOVA).

