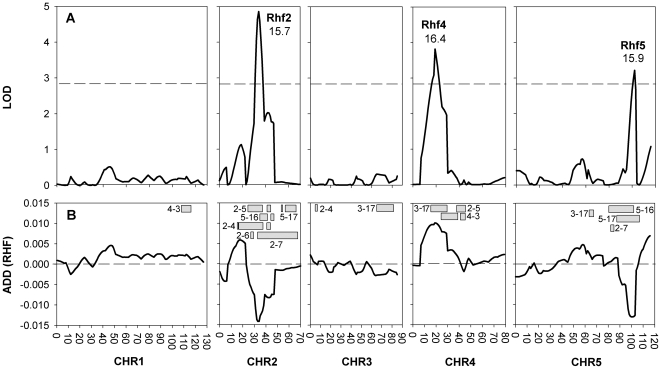
Figure 4. QTL analysis reveals three loci explaining the RHF.
(A) QTL-LOD profile of RHF per chromosome (CHR). The dashed line marks the 95% confidence threshold at LOD 2.89. Percentage explained variance and QTL names are given near each QTL peak. (B) Additive effect of the Cvi-0 allele compared to the population average. Boxes schematically show the positions of the Cvi-0 introgressions of the NILs used to confirm the QTLs. Numbers depicted are the LCN line-numbers. The average map position of the flanking Ler marker and the border Cvi-0 marker are depicted as cross-over position.

