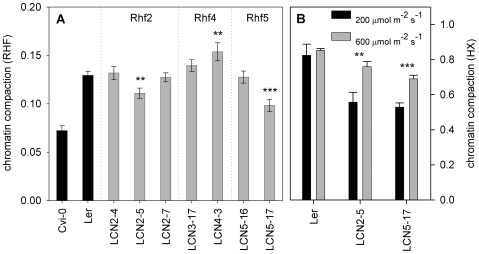
Figure 5. Near Isogenic Lines confirm the QTL positions and effects.
(A) RHF of the NILs with a Cvi-0 introgression in the Ler genetic background at the Rhf QTL loci, in control light conditions. The parents used to generate the NILs are in black. NILs are in gray. QTL names are depicted above the NILs. n>13 nuclei. (B) HX (n≥2) of LCN2-5 and 5-17 at 200- (black bars) and 600 µmol m−2 s−1 (gray); Error bars represent SE in al cases. ** p<0.01; *** p<0.001 significance value compared to Ler (A) or compared between plants of one genotype grown in 200 µmol m−2 s−1 compared to the same genotype grown in 600 µmol m−2 s−1 (B).

