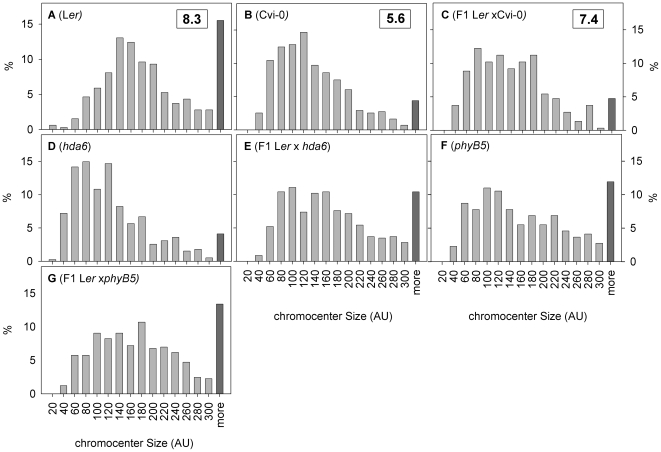
Figure 9. NOR chromocenter size is specifically affected in Cvi-0 and hda6.
Distribution of size per individual chromocenter in Arbitrary Pixel Units (AU) of F1 plants derived from crosses between hda6 and phyB mutants and their parental wild types. Boxed numbers indicate the average number of detectable chromocenters per nucleus. The highest class for both distributions is defined on a 10% cutoff.

