
Figure 2.
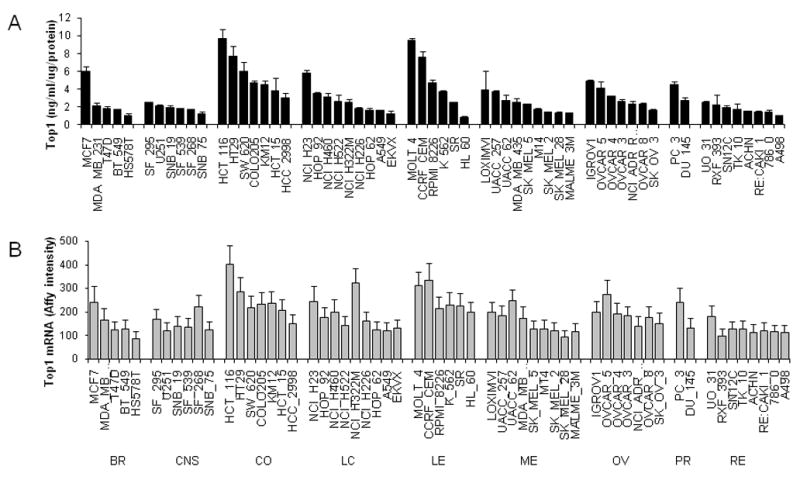
Top1 (A) enzyme and (B) mRNA levels in the NCI-60 cell line panel. Data are presented by cancer type in decreasing order of Top1 enzyme level. Top1 ELISA data have been normalized to 1 μg protein; data represent the mean ± SD for at least three cell extracts. Affymetrix microarray data is the mean ± SD for data from six probes each normalized using gcRMA method. BR-Breast, CNS-central nervous system, CO-colon, LC- lung cancer, LE-leukemia, ME- melanoma, OV-ovarian, PR-prostate, RE-renal.