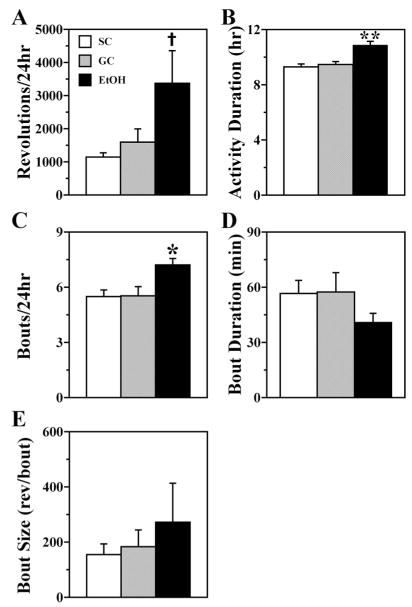
Fig. 3.
Quantitative parameters of wheel-running activity in SC (open bar), GC (shaded bar), and EtOH (solid bar) rats during exposure to DD. Bars represent the mean (± SEM) values for (A) total wheel revolutions per day, (B) duration of the active phase, (C) number of activity bouts per day, (D) duration of activity bouts, and (E) bout size expressed as the number of wheel revolutions per bout. Total daily activity was significantly increased (†p < 0.05) relative to that found only in the SC group. The duration of the active phase and the number of activity bouts per day were significantly greater (*p < 0.05; **p < 0.01) in EtOH rats (n = 8) than in both SC and GC animals (@ n = 8).

