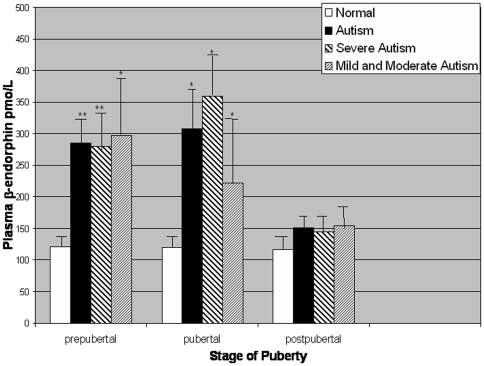
Figure 3. Group mean plasma β-endorphin concentrations.
Error bars represent SEM. Asterisks indicate significant differences within pubertal subgroups between normal controls and patients with autism: *P<0.01,**P<0.001. Among the total group of individuals with autism, both pre-pubertal and pubertal individuals had significantly higher β-endorphin levels than post-pubertal individuals (P<0.01).

