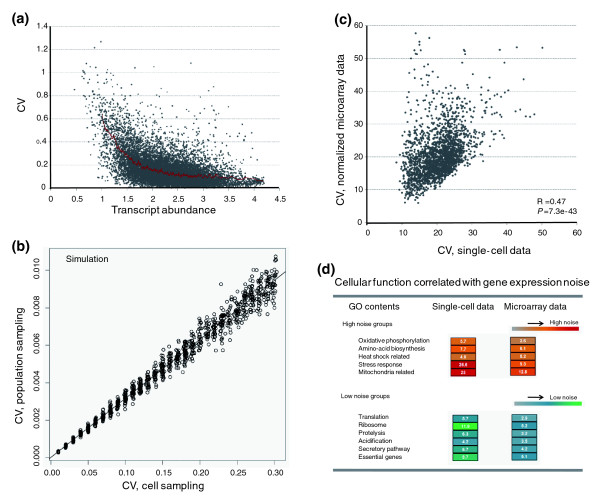
Figure 1.
Measuring transcriptional noise employing microarray data. (a) Negative correlation between gene abundance and expression variation demonstrated by data from HaCAT cells cultured in the same normal condition. Each dot presents each gene while the red curve presents the mean expression variation in a running window of 100 genes. (b) Noise on the between-cell level and that on the between-population level are highly correlated according to simulation. In this simulation we considered a population of 10,000 cells all with the same underlying mean abundance and a given standard deviation. First, CV was calculated for 10,000 randomly generated data points (cell sampling). Next, we considered 100 populations of size 1,000 with the same mean and standard deviation. We simulated each using the same mean and standard deviation then considered the between-population CV as being the standard deviation between the Means of 100 populations/Mean of the means of the 100 populations. (c) Noise on the between-cell level and that on the between-population level are highly correlated, as demonstrated by experimental data in yeast. The plot shows the noise value (CV) measured by our microarray approach plotted against that measured by a previous single-cell approach. The noise values (CV) measured by our microarray are normalized to be comparable to the previous single-cell data in yeast (with equalized mean CV values). (d) Cellular function is correlated with transcriptional variation. For example, proteins participating in stress response exhibit large variation whereas proteins participating in translation exhibit low variation. The high or low variation groups identified by the single-cell approach and microarray data are highly consistent, indicating that microarray data can accurately identify high or low noise classes of gene. GO, Gene Ontology.

