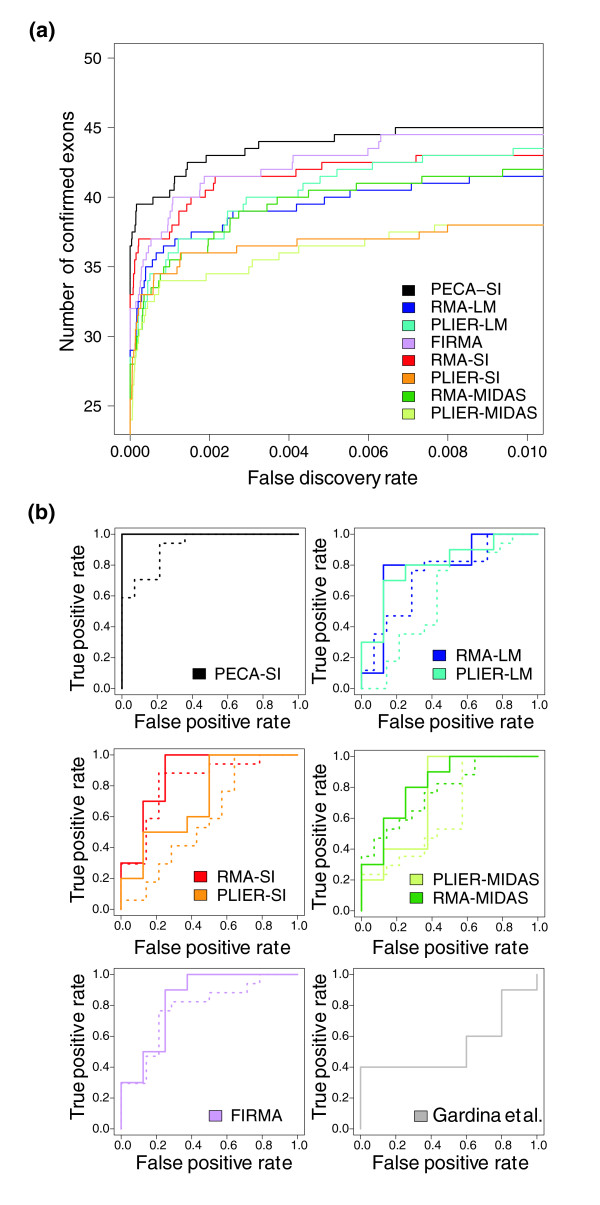
Figure 4.
Detection of confirmed splicing events. Performance of PECA-SI, RMA-SI, PLIER-SI, RMA-MIDAS, PLIER-MIDAS, RM-LM, PLIER-LM and FIRMA in terms of RT-PCR validations. (a) The average number of previously confirmed brain-specific splicing events (y-axis) is shown as a function of the false discovery rate (x-axis) across the two laboratories. (b) The ROC curve shows the true positive rate (true positives divided by all positive detections) as a function of the false positive rate (false positives divided by all negative detections) in the colon cancer data. The solid lines correspond to the filtered data (10 positives, 8 negatives), and the dotted lines to the unfiltered data (17 positives, 14 negatives). The results reported in [27] were included as a reference (10 positives, 5 negatives). For the clarity of illustration, the curves for the different analysis approaches are shown in separate graphs. When comparing the curves, the one closest to the upper left corner shows the best performance.

