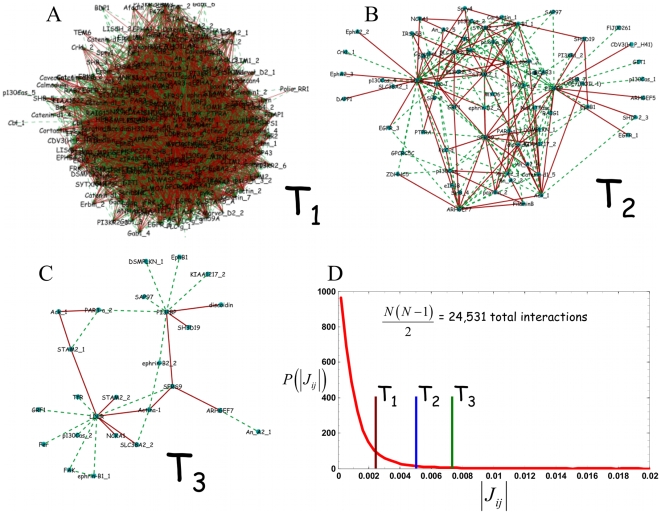
Figure 2. Threshold dependent phosphorylation interaction networks.
Graphical depictions of inferred phosphotyrosine interaction networks at different thresholds. Green lines denote positive connections and red lines denote negative connections. Networks at three thresholds are shown: a.)  , b.)
, b.)  , and c.)
  d.) Histogram of the magnitude of the
  interactions and the relative location of the
 ,
,  , and
, and  cutoffs.

