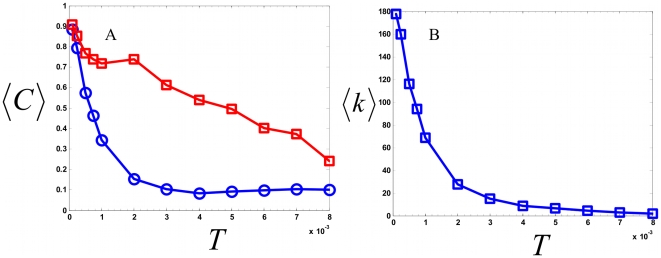
Figure 3. Clustering properties of the inferred signaling networks.
Topological properties of inferred signaling networks as compared to those of a random network. a.) Average clustering coefficient  is plotted against different values of interaction threshold T. Maximum entropy network (red, squares) and a random network with the given number of nodes and edges of inferred network (blue, circles) are considered. b.) mean number of nearest nodes
  plotted against the interaction threshold T.

