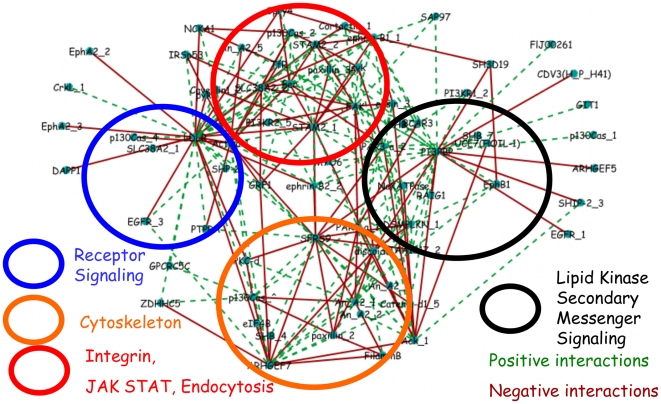
Figure 4. Inferred interaction network at intermediate threshold gives a modular, biologically interpretable signaling network.
Graphical depiction of the signaling network at intermediate ( ) threshold. (Tyrosine phosphorylation sites are grouped, for visualization, into four functional categories: receptor signaling (blue circle), cytoskeleton (orange circle), lipid kinase secondary messenger signaling (black circle), and integrin, JAK/STAT signaling, and endocytosis (red circle). Green connections denote positive and red connections denote negative interactions. Full annotation for each abbreviated site name shown in the graph is given in the supplementary information

