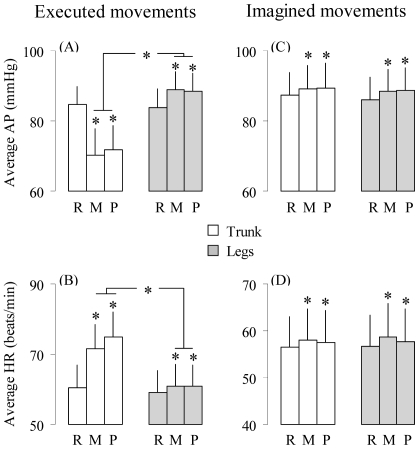
Figure 3. Arterial pressure (AP) and heart rate (HR).
Average values (±SD) of AP and HR during the rest (R), the movement (M) and the posture (P) phases are illustrated for both trunk (white bars) and leg movements (grey bars). (A–B) executed movements. (C–D) imagined movements. Stars (*) indicate significant differences (p<.05).

