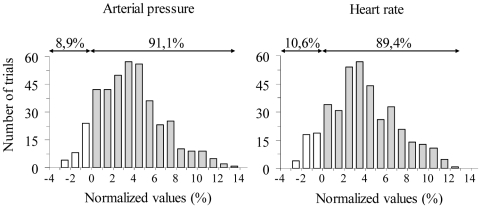
Figure 4. Normalized values of Arterial Pressure (AP) and Heart Rate (HR).
The distribution of normalized values of AP (AP = MPAP/RAP ×100−100) and HR (HR = MPHR/RHR ×100−100) are shown for the imagined trunk and leg movements. Arrows represent the proportion of positive (grey bars) and negative (white bars) normalized values. MPAP: average AP during the movement and the posture phases; RAP: average AP during the rest phase; MPHR: average HR during the movement and the posture phases: RHR: average HR during the rest phase.

