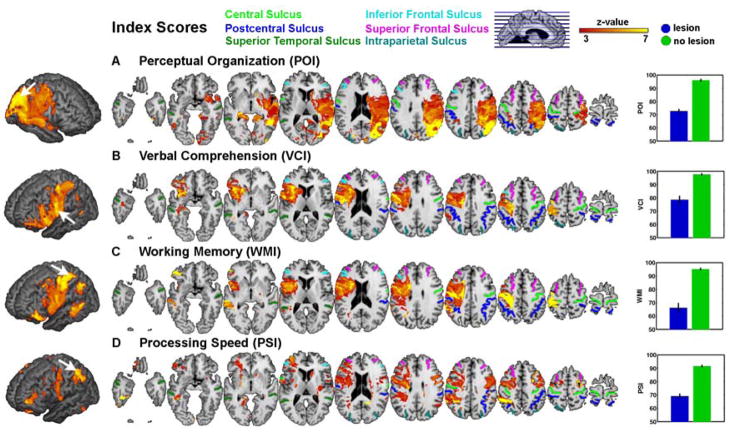
Figure 2.
Voxel-based lesion symptom mapping of four cognitive indices of intelligence. Our VLSM analyses compared the index scores for patients with a lesion against those without a lesion, at each and every voxel. All colored regions in the slice-wise display and the 3D projection (left; search depth 8 mm) survived a statistical threshold of 1% FDR. The size of the effect (greater Z-values) is color-coded with warmer colors corresponding to a greater difference. The graphs on the right show the mean difference on each index score between those patients whose lesions included the voxel showing the maximum effect (black arrow on the 3D projection) and those whose lesions did not include it (errorbar = s.e.m.). (a) perceptual oranization (b) verbal comprehension, (c) working memory, (d) processing speed.

