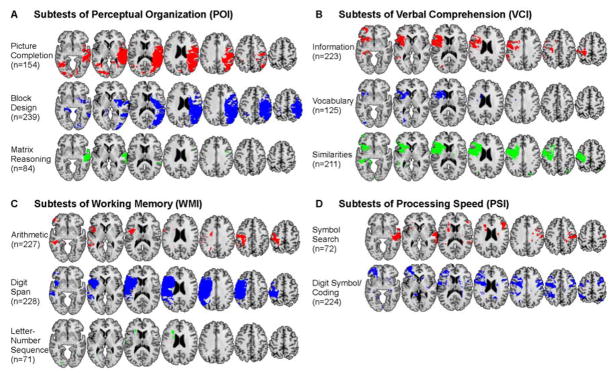
Figure 3.
VLSM analyses for all subtests from the Wechsler Adult Intelligence Scale. Subtests are grouped within the same four cognitive indices shown in Figure 2, and with the same uniform statistical thresholds as in Figure 2 (1% FDR). Regions with significant lesion-deficit relationships are thresholded and shown in unique colors corresponding to each subtest.

