
Figure 5.
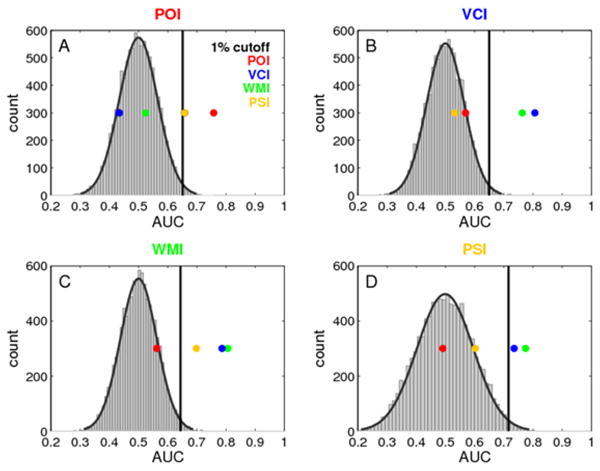
Specificity and sensitivity of the findings. Area under the ROC curve (AUC) is shown for each index score in a cross-validation analysis (four colored dots). The ROC was derived from each index score and an independent overlap measure for each patient with the rest of the sample in individual leave-one-out VLSM analyses. The empirical null distribution (gray histogram with Gaussian fit superimposed) was derived by 10000 permutations of the index scores. The 99th percentile of this distrbution was defined as the critical threshold for statistical significance. The colored dots indicate the AUC of the original ordering of index scores and overlap measures (the colored dot that corresponds to the title of each graph) (sensitivity) as well as the AUC of each other index score with the individual overlap measure (specificity).