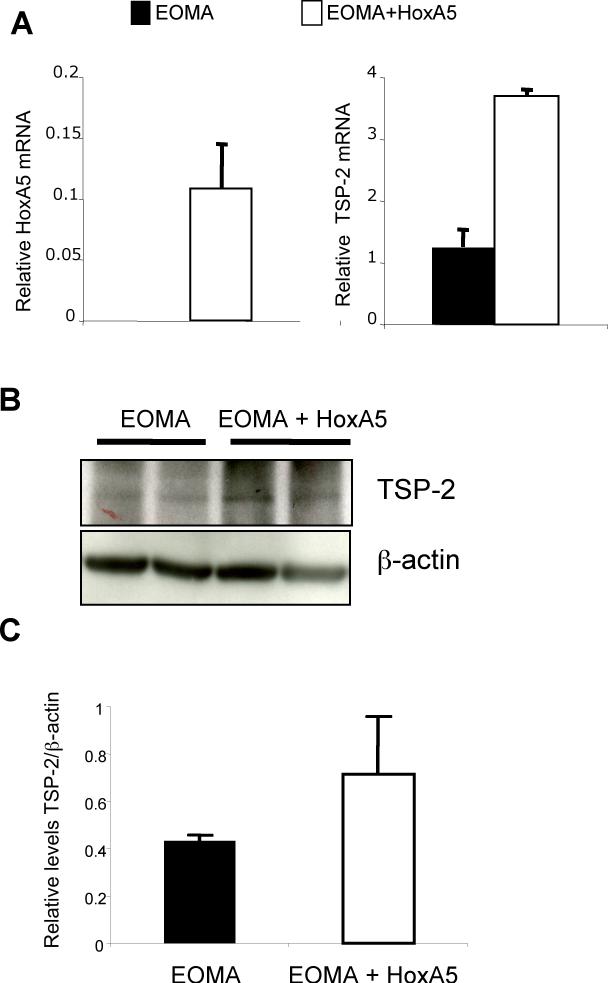
Figure 3.
HoxA5 increases expression of TSP-2 in BH. A) Real-time PCR showing levels of HoxA5 (left panel) and TSP-2 mRNA (right panel) in EOMA control or HoxA5-transfected EOMA cells. B) Western blot analysis shows the levels of TSP-2 protein in BH samples from mice injected with EOMA cells and HoxA5 expressing EOMA cells (upper panel). The same membrane was stripped and re-probed with β-actin to assess total protein loading. C) Quantitative analysis of relative TSP-2 levels in the Western blots for n=3 animals. p=0.109. The densitometric analysis was performed using the Image J program (rsb.info.nih.gov/ij/).

