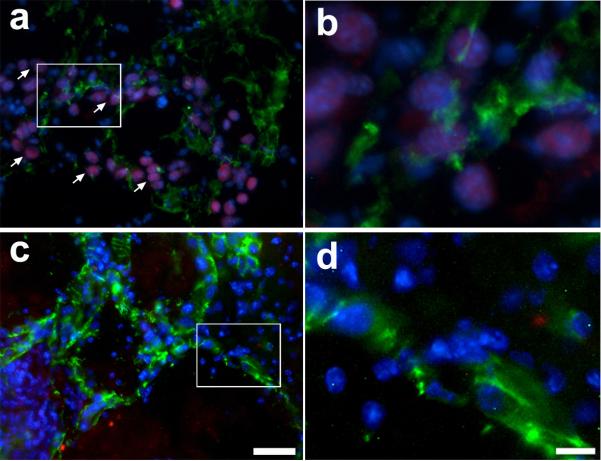
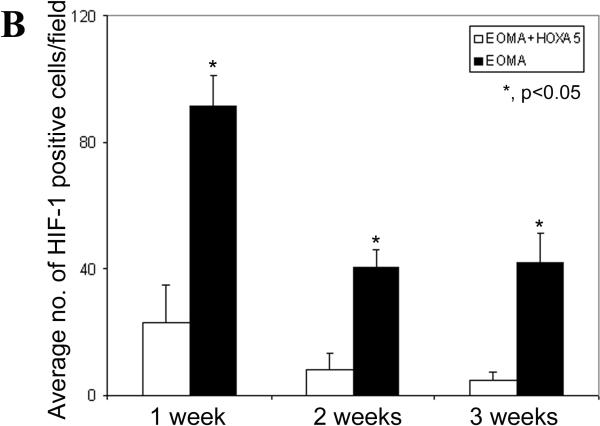
Figure 4.
HoxA5 reduces HIF1α in BH. A) Photomicrographs show HIF-1α (red), CD31 (green) and dapi (blue) expression within the hemangioma-like lesion in the EOMA (a, b), or HoxA5-expressing EOMA cells (c, d) transplanted into the mouse brain after 2 weeks of injection. Arrows point to representative positive nuclei staining for HIF-1α. Scale bar (a, c) = 40 μm, (b, d) =10 μm. B) Bar graph shows the average number of HIF-1α positive cells counted per field per group at each time point. Data are mean±SD, n=6 in each group. *, p<0.05 for the difference between EOMA+HoxA5 vs. EOMA group for same time point.


