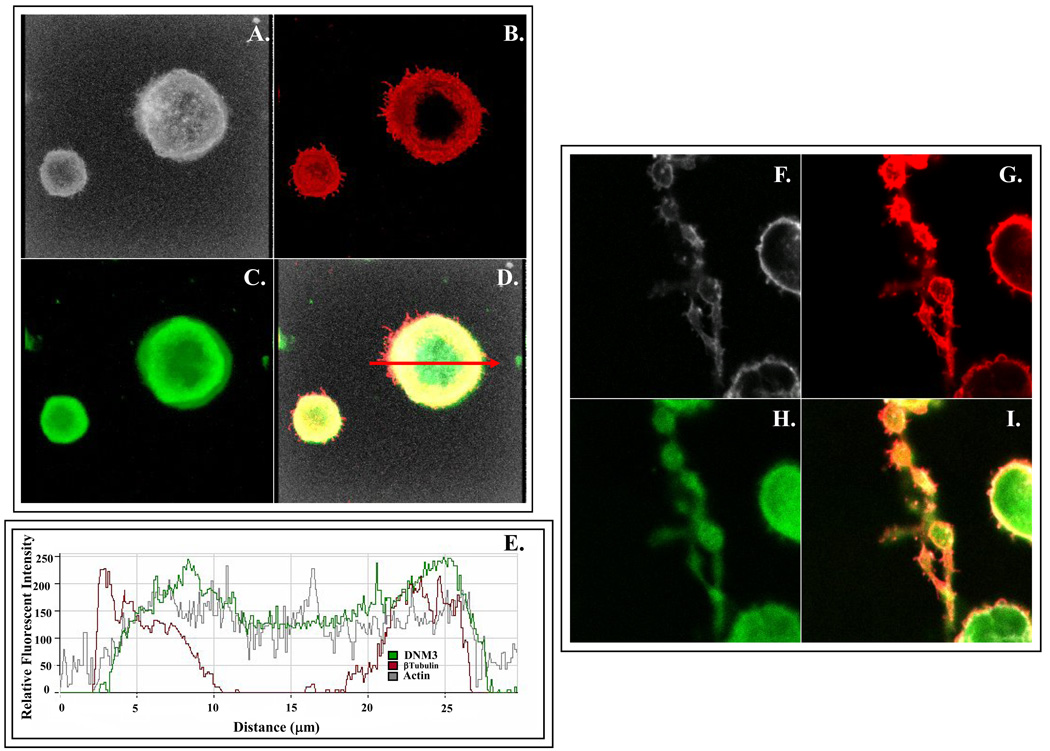
Figure 3. Representative immunofluorescent confocal micrographs showing the distribution of DNM3 relative to tubulin α/β and actin in representative culture derived human MKs and MKs displaying proplatelet processes produced from human UCB CD34+ cell.
(A–D) Staining patterns in a culture derived human MK produced from umbilical cord blood CD34+ cells. Shown separately in panels are: A) Bodipy-phalloidin (white), B.) anti-DNM3 (green) and C) anti-tubulin (red). D) Merge of actin, DNM3 and tubulin staining. Arrow represents the cross-sectional region that was scanned to obtain the histogram in 3E, which graphically profiles actin (gray line) DNM3 (green line) and tubulin (red line). (F–I) Representative proplatelet processes stained with the following: F) Bodipy phalloidin (white), G.) anti-DNM3 (green) and H) anti-tubulin (red). I) Merge of actin, DNM3 and tubulin staining.

