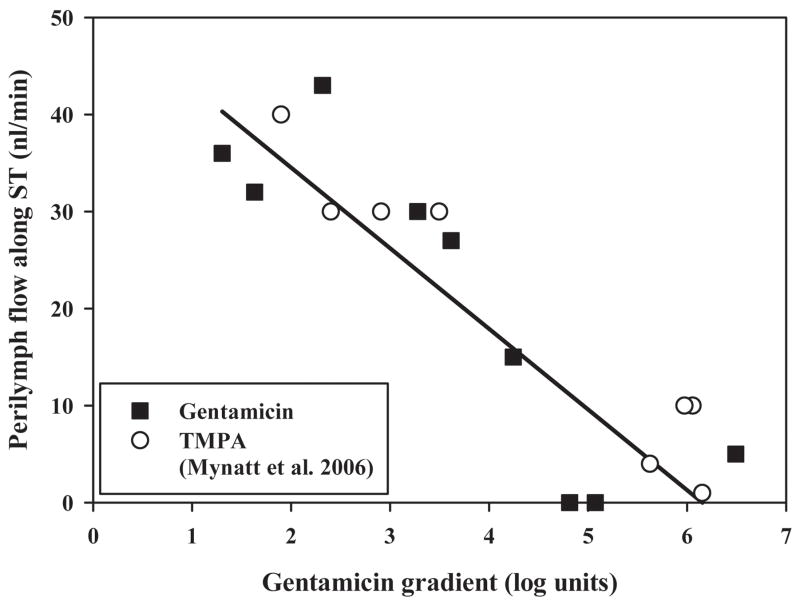
Figure 5.
Relationship between the measured gentamicin gradient along scala tympani and the rate of volume flow along scala tympani needed to best-fit the data using the computer model. Data are shown both from the current study and a prior study which utilized the marker ion TMPA. The line fitted to the gentamicin data had a slope of −8 nl/min per decade of concentration gradient. The highest estimated rate of flow was 43 nl/min.

