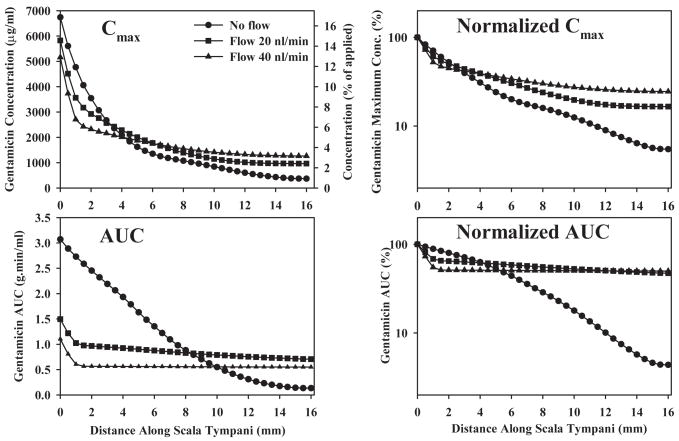
Figure 7.
Calculated Cmax (maximum concentration of drug reached) and AUC (integrated area under the curve of drug concentration with time) as a function of distance along ST. The curves are calculated for a 3-hour drug application in guinea pigs for three rates of volume flow along ST. Absolute concentrations are shown in the left column and amplitude normalized values (relative to the location of highest value) are shown in the right column. Absolute Cmax also includes a scale showing the concentration relative to the applied dose.

