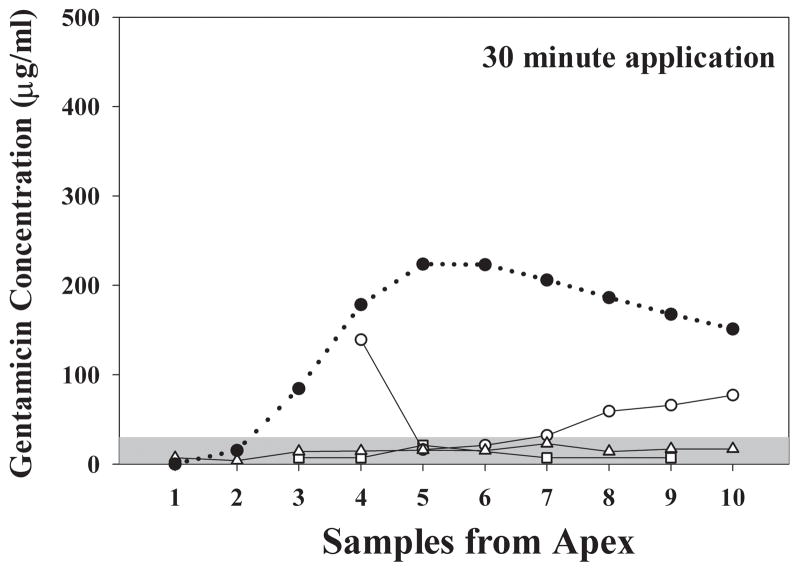
Figure 8.
Open symbols: Gentamicin concentration of samples taken from the apex following a 30 minute application of gentamicin to the RWM. The three solid lines show individual experiments. Only low levels of gentamicin were detected. The solid symbols / dotted line show the predicted concentration of apical samples based simulation of this application protocol with the mean parameters derived from 2 and 3 hour application data. The measured sample concentrations were substantially below those expected based on longer application times.

