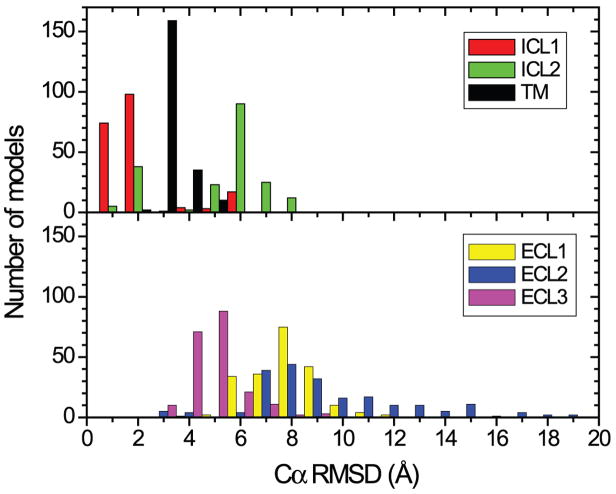
Figure 4.
Distribution of Cα RMSDs for TM helices I to VII (helix I: 6–34; helix II: 40–67; helix III: 73–107; helix IV: 117–142; helix V: 173–205; helix VI: 222–258; helix VII: 266–291), and the loop regions (ICL1: 35–39; ICL2: 108–116; ECL1: 68–72; ECL2:143–172 excluding 149–155 that are missing in the crystal structure; ECL3: 259–265).

