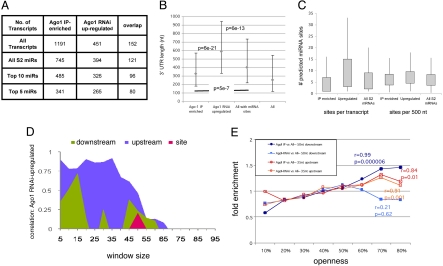
Fig. 4.
A comparative analysis on Ago1 IP-enriched transcripts Vs Ago1 RNAi-up-regulated transcripts. (A) Numbers of mRNAs with target sites identified by IP or by Ago1 RNAi. IP-enriched used a cutoff >1.4-fold and P < 0.05. Ago1 RNAi set from (12): up-regulated >1.5-fold (P < 0.05). All: all S2 cell mRNAs; all S2 miRNA: those with sites for any S2 miRNA. (B) y axis: median UTR length (nt) represented by gray squares. The range between 1st and 3rd quartiles are indicated by bars. P values: Wilcoxon U test, Bonferroni corrected (4 tests per group). The median for the Ago1 RNAi set is 262 nt longer than the IP set (P = 6e-21) and 187 nt longer than for all RNAs with sites (P = 6e-13). The IP set was 75 nt shorter than all RNAs with sites (P = 5 × 10⁻⁷). (C) Site density profiles in IP-enriched vs. Ago1 RNAi-up-regulated targets and all S2 miRNAs. The up-regulated set has more sites/transcript than the IP set (median shift 4, P = 2 × 10⁻¹⁸) or than all RNAs with sites (median shift 3, P = 1 × 10⁻¹⁴). Median site density was 6.9/500 nt in the up-regulated set vs. 6.0 for the IP set and 5.6 for all RNAs. These differences were significant using a K-S test (two tail). (D) Assessment of site openness for the Ago1 RNAi up-regulated set vs. all RNAs with sites (as in Fig. 3B). (E) Fold enrichment for the optimal upstream and downstream windows in IP-enriched and Ago1 RNAi up-regulated sets. x axis: average nucleotide openness binned from 10% to 80%. y axis: fold enrichment as compared with all S2 transcripts with sites, which were used as the common control. Pearson's correlation coefficient, r values and associated P values are shown.

