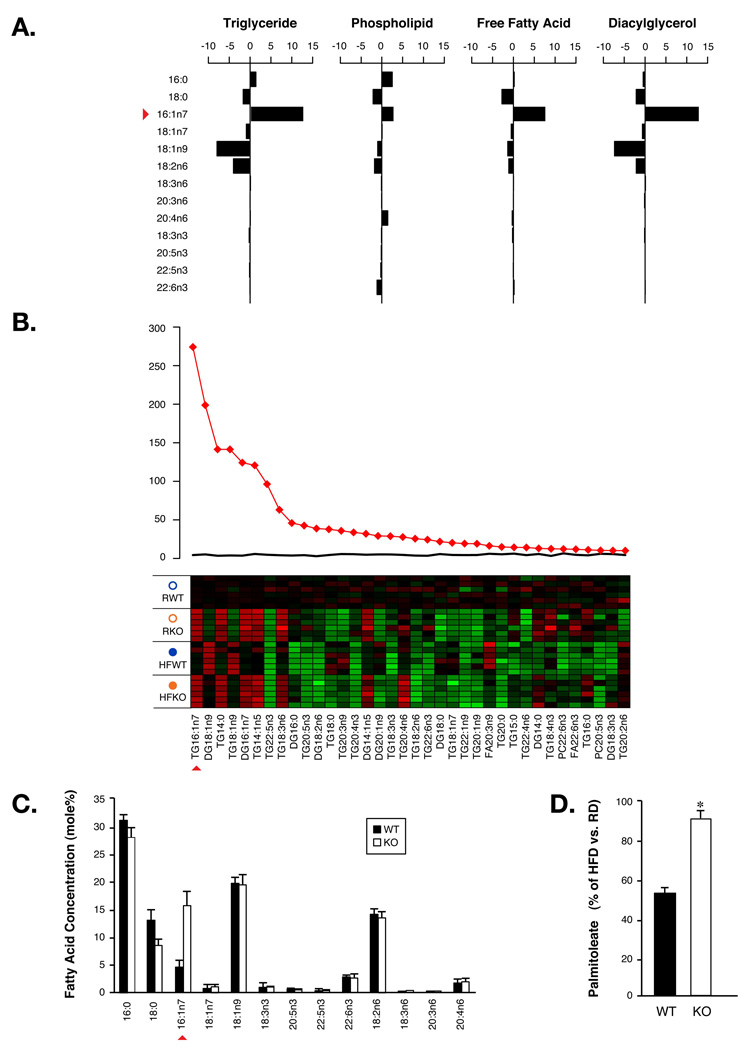
Figure 2. Adipose de novo lipogenesis and palmitoleate production.
A. Difference of major fatty acids in diacylglycerol, free fatty acid, phospholipid and triglyceride fractions in adipose tissue between the mean of WT and FABP−/− mice. B. Lipid class composition analysis for FAs in adipose tissue. The top 36 metabolites are shown. The F-statistics from a one-way ANOVA are displayed as red diamonds over the distribution of F-statistics from permuted data. The black line is the maximum F statistic observed in 100 permutations. The heat map displays the observed data, centered to the mean of the control group and scaled by the standard deviation of all observations. C. Plasma FAs in WT or FABP−/− (KO) mice. D. Percentile suppression of palmitoleate by HFD in adipose tissue of WT or KO mice. Error bars represent the SEM.

