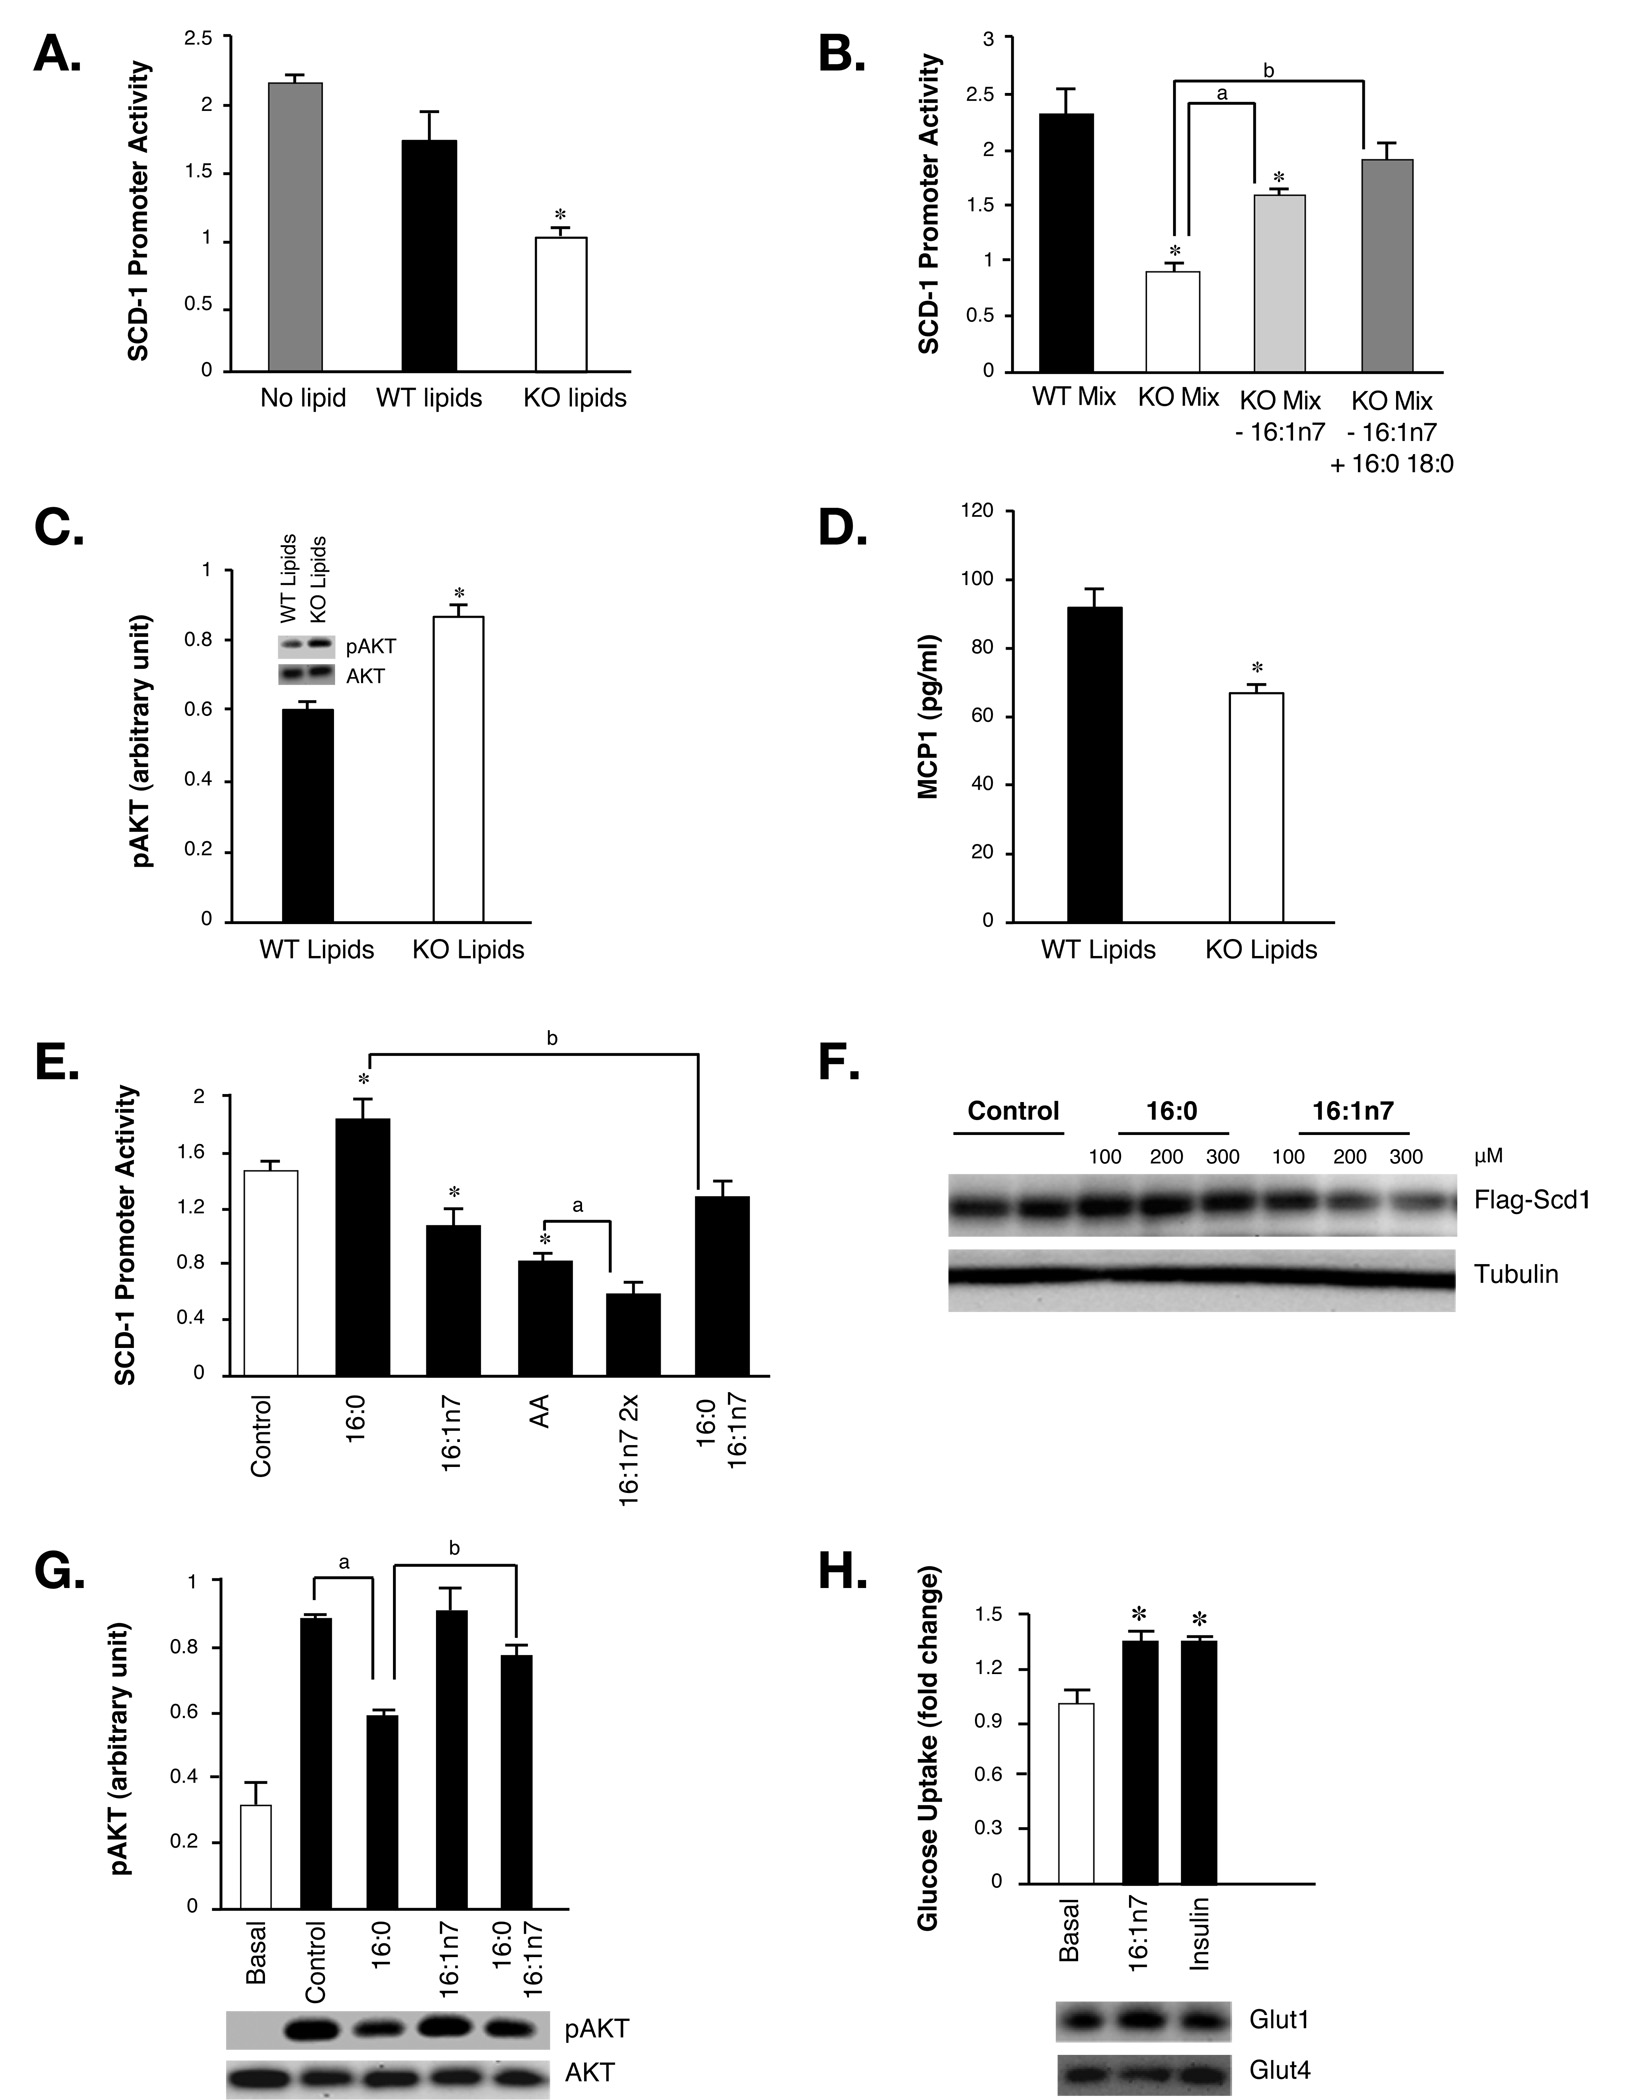
Figure 3. Metabolic regulation by plasma lipids.
A. SCD-1 promoter activities in control hepatocytes (No lipid) or hepatocytes treated with plasma lipids extracted from WT or FABP−/− (KO) mice. B. SCD-1 promoter activities in hepatocytes treated with fatty acid mixtures resembling the ratio of plasma fatty acids from WT mice (WT Mix), KO mice (KO Mix), KO mice with the concentration of palmitoleate of WT mice (KO Mix, 16:1n7), or KO mice with the concentration of palmitoleate, palmitate, and stearate of WT mice (KO Mix, 16:1n7, + 16:0 18:0). Asterisk, significantly different from WT mix; a and b, significantly different from KO Mix. C. Insulin-stimulated AKT phosphorylation in C2C12 myotubes treated with plasma lipids extracted from WT or KO mice. Values of bar plot were determined by phospho-AKT ELISA and corresponding immunoblotting results are shown as insets. D. MCP1 in conditional medium of adipose explants treated with plasma lipids of WT or KO mice. E. SCD-1 promoter activities in hepatocytes treated with fatty acids. All fatty acids were used at 300 µM final concentration except C16:1n7 2x is 600 µM. AA: arachidonic acid; asterisk: significantly different from controls; a: significantly different from AA-treated cells; b: significantly different from palmitate-treated cells. F. Immunobloting of Flag-tagged SCD-1 in hepatocytes treated with control, palmitate and palmitoleate. Tubulin was used as loading control. G. AKT phosphorylation in C2C12 myotubes treated with fatty acids and insulin. a: significantly different from cells treated with insulin; b: significantly different from cells treated with both insulin and palmitate. The bottom panel is the corresponding immunoblotting of total and phosphorylated AKT in cells treated with pooled lipids. H. Glucose uptake in C2C12 myotubes treated with insulin or palmitoleate. Top panel is immunoblotting of C2C12 cell lysates treated with insulin or palmitoleate using anti-Glut1 or Glut4 antibodies. Asterisk, p < 0.05. Error bars represent the SEM.

