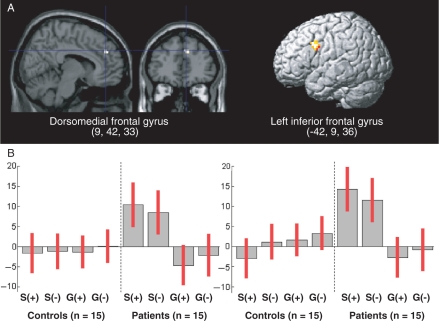
Fig. 2.
(A) Group × condition interaction: regions activated in ‘self’ vs ‘general’ condition, in patients vs controls. (B) Contrast estimates and 95% confidence interval for the following contrasts: self/positive vs control (S+), self/negative vs control (S−), general/positive vs control (G+) and general/negative vs control (G−).

