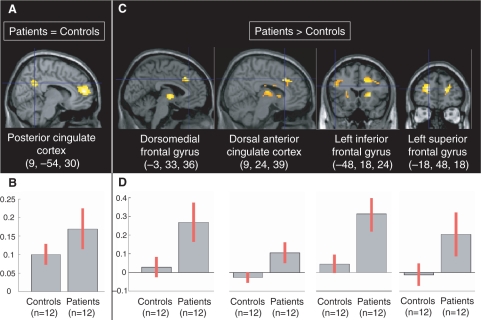
Fig. 3.
(A) Regions whose activity was positively correlated with the MFG (6, 48, 18) activity equally in controls and patients. (B) Contrast estimates and 95% confidence interval regarding the functional connectivity of the MFG (6, 48, 18) in controls (left) and patients (right). (C) Regions whose activity was positively correlated with the MFG (6, 48, 18) activity more in patients than controls. There were no regions whose activity was positively correlated with the medial frontal gyrus (MFG) (6, 48, 18) more in controls than patients. (D) Contrast estimates and 95% confidence interval regarding the functional connectivity of the MFG (6, 48, 18) in controls (left) and patients (right).

