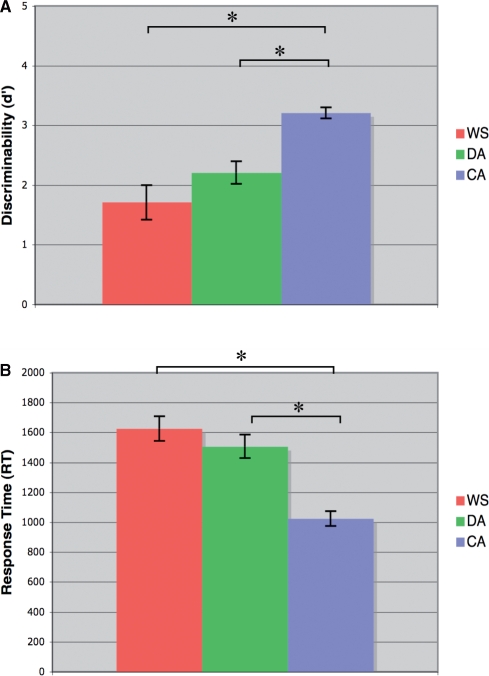
Fig. 2.
Behavioral session results, face-matching task. (A) Accuracy. (B) RT. Results revealed an effect of group membership for both dependent variables [d′: F(2,42) = 17.39, *P < 0.001; RT: F(2,42) = 20.64, *P < 0.001]. Follow-up Tukey tests revealed the same pattern of results for both variables: both the WS and DA groups were outperformed by the CA group, with respect to both accuracy and RT (P < 0.001 for all t-test comparisons). The performances of the WS participants and DA controls, as expected, were not different (P > 0.2 for both d′ and RT).

