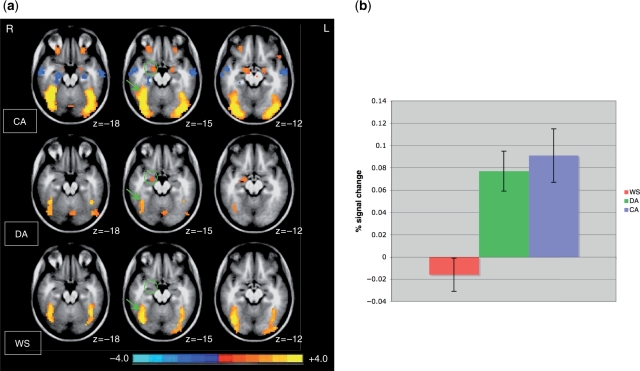
Fig. 3.
Activation in ventral occipito-temporal regions and the amygdala. (A) Mean z-score images depicting active voxels (P < 0.05, corrected) in CA-matched controls (top), developmental controls (middle) and WS (bottom). Data are displayed in radiological convention (right is on left). Green circles denote significant activation in both control groups in the right amygdalar region, absent in the WS group. Green arrows denote activation in all three groups in the fusiform gyrus, a region in ventral occipito-temporal cortex, i.e. highly sensitive to faces. Except for one focus in a more superior aspect of the fusiform gyrus, where the WS group showed more robust activation than both control groups [Talairach coordinates (38, –69, –9); % signal change = 0.21 for WS, 0.079 for DA controls and 0.13 for CA controls), most ventral occipito-temporal regions showed comparable levels of activation between the WS and DA groups. (B) Mean activation within a spherical region-of-interest (radius = 4.5 mm) placed within the right amygdalar region.

