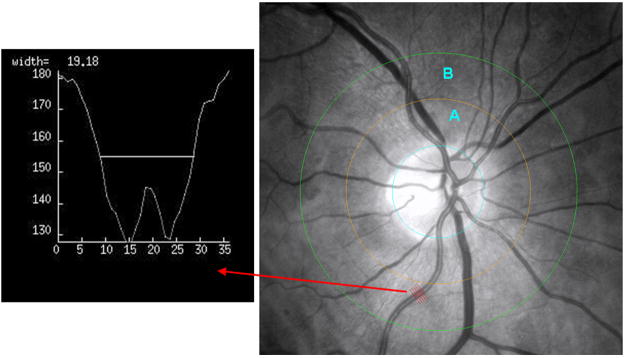
Figure 1.
Cropped and red-free retinal photograph showing the outline of the optic disc (blue) and circles at 0.5 and 1.0 disc diameters (yellow and green respectively) out from the disc margin, thus creating zone A and zone B. The red arrow points from the 5 equidistant lines sampling the artery segment to the corresponding profile generated by one of those lines.

