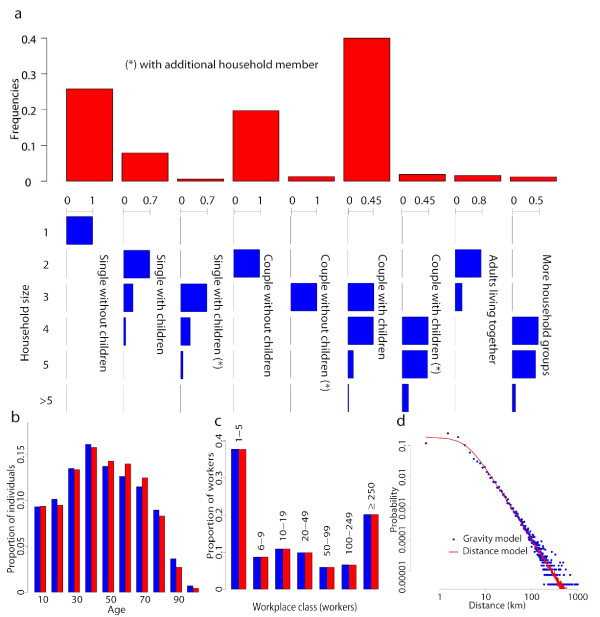
Figure 1.
Sociodemography. a Frequency distributions of household size for the different household types (in blue) and frequency distribution of the different household types (in red) considered in the model. b Age distribution from census data (blue) and simulated (red). c Proportion of workers for class of workplace from industry census data (blue) and simulated (red). d Probability density function of travel distances as obtained by using the gravity model (3) (in blue) compared with that obtained by using the the distance kernel (2) (in red).

