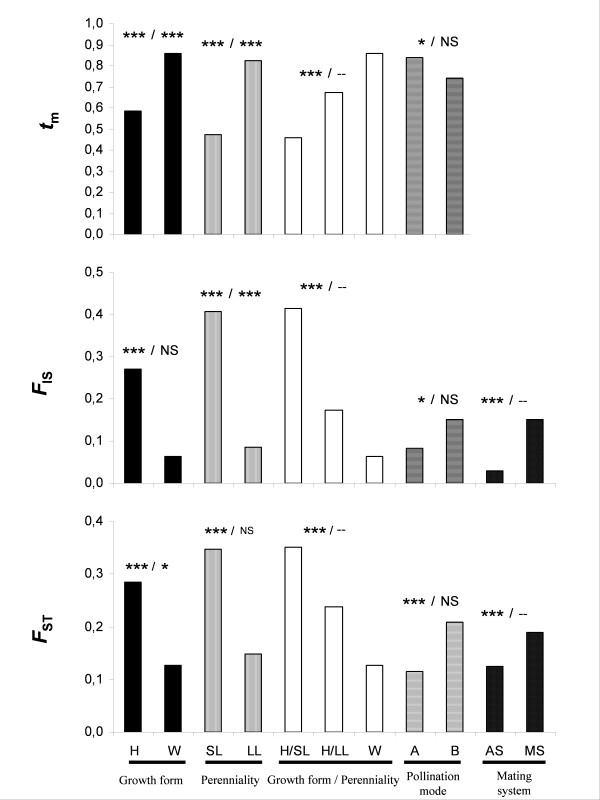
Figure 1.
Mean values of tm, FIS and FST as a function of growth form (H: herbaceous, W: woody), perenniality (SL: short-lived, LL: long-lived), the combination of growth form and perenniality (H/SL: herbaceous short-lived, H/LL: herbaceous long-lived, W/LL: woody long-lived), the mode of pollen dispersal (A: abiotic, B: biotic) and outcrossing rate (MS: mixed mating species, AS: allogamous species). For each category the P-value associated with the statistical test is indicated by *** P < 0.001, ** 0.001<P < 0.01, * 0.01<P < 0.05 and NS for P > 0.05. At the left part of the slash the P-value corresponds to the TIPs test and at the right to the PICs test. "--" indicates an absence of statistical test. Standard error values for each category is available in the additional file 3.

