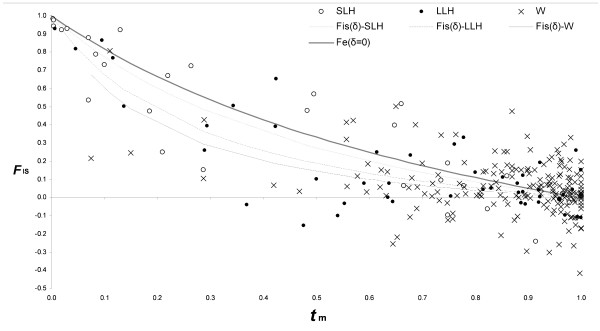
Figure 4.
Distribution of FIS according to tm. The open circles correspond to short-lived herbaceous species, the closed circles to long-lived herbaceous species and the crosses to woody species. The thick continuous line represents Fe, which is the expected FIS based on the observed tm, assuming a mixed-mating system at equilibrium without inbreeding depression. The other lines correspond to the best-fitting curves according to equation 1 after adjusting the level of inbreeding depression, δ, for short-lived herbaceous species (short-hatched line), perennial herbaceous species (long-hatched line) and woody species (continuous line).

