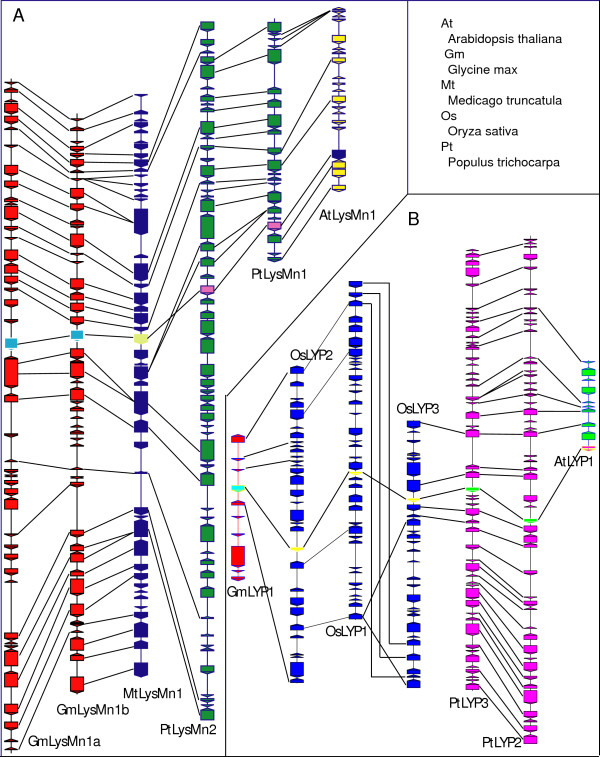
Figure 6.
Collinearity of genomic blocks surrounding plant LysMn1 (A) and LYP (B) genes. Genes are shown in boxes with orientations indicated by a triangle. The blocks are colored differentially for each plant species. Plant LysMn1 and LYP genes are shown in inverted colors in each block. Orthologous genes are connected using solid black lines.

