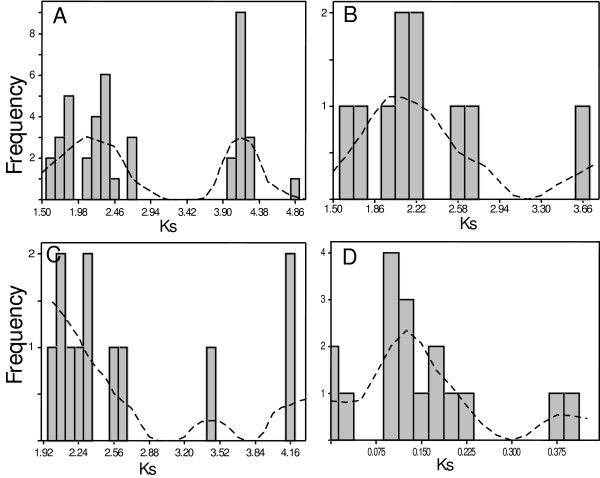
Figure 7.
Histogram plots of pairwise synonymous distance of LYK genes and LysM genes in soybean. Y-axis denotes the frequency and x-axis denotes the synonymous distance (Ks). A: LYK clade I vs II; B: LYK subclade IA vs IB; C: subclade IIA vs IIB; D: homeologous LysM genes in soybean. The dash lines in each panel are the smoother lines. The peaks of the smoother lines indicate the relative timing of diverging events.

