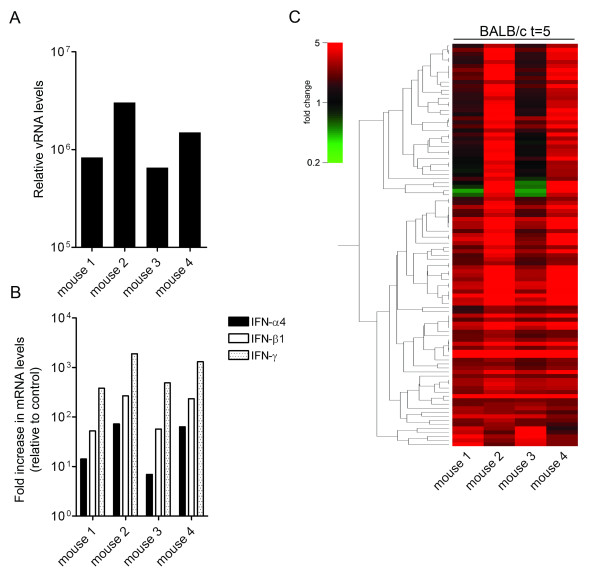
Figure 3.
Induction of gene expression correlates with the viral load. vRNA (panel A) and IFN-α4, IFN-β1, and IFN-γ mRNA (panel B) levels within the brains of the individual BALB/c mice (mouse 1–4) at 5 days post infection were determined as described in the legend of Figure 1. (C) Microarray data analysis of the individual BALB/c mice (mouse 1–4). The gene tree shown (n = 96) is based on the significant alterations at 5 days post infection while applying an expression cut-off (≥ 2.0 fold). For detailed information see Additional file 2.

