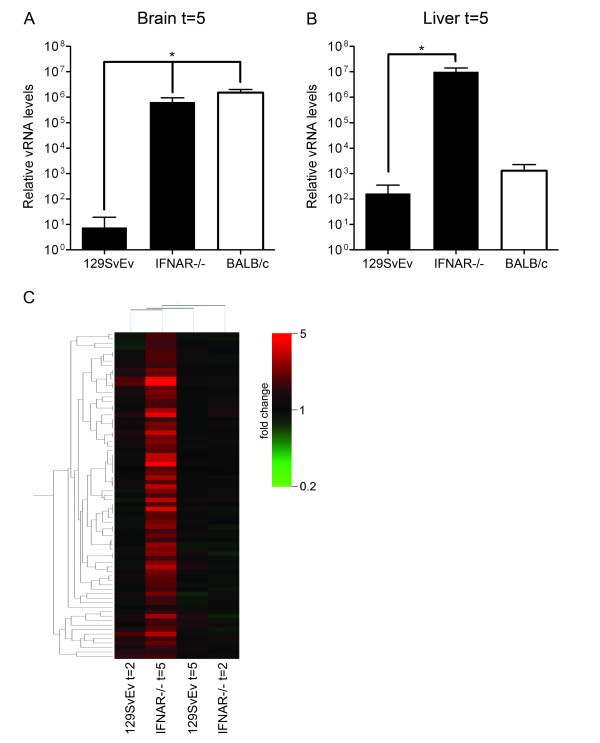
Figure 4.
The type I IFN receptor-independent expression profile within the brains of IFNAR-/- mice after MHV infection. IFNAR-/- 129SvEv mice were intranasally inoculated with 106 TCID50 of MHV-A59 or treated with PBS (control). At day 5, mice (n = 4) were sacrificed and the brains and livers were harvested. (A and B) The vRNA levels within brains and livers were determined as described in the legend of Figure 1. Standard deviations are indicated (*P < 0.0001). Also depicted are the vRNA levels for the parental 129SvEv mice and BALB/c mice. (C) Total RNA samples obtained from the brains of PBS- or MHV-inoculated IFNAR-/- mice were processed for microarray analysis as described in the legend to Figure 1. Based on the significant alterations (≥ 1.5 fold change cut-off) in gene expression within the brains of the IFNAR-/- mice at 5 days post infection (n = 73) a gene tree was build. The different conditions (i.e. mouse strain and day post infection) are indicated. See Additional file 3 for details. Note that the different conditions are also clustered according to their similarities in the complete gene expression profile.

