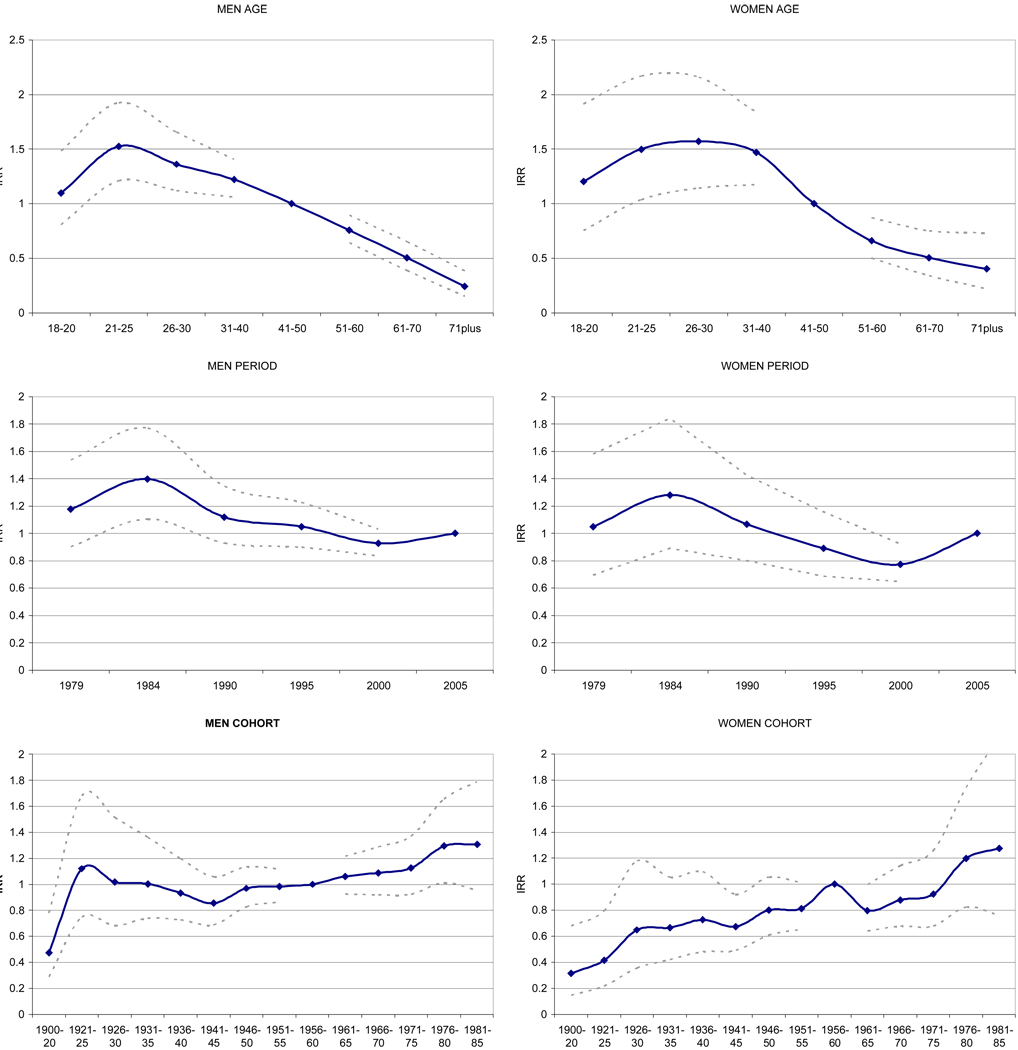
Figure 3.
Age, period and cohort effects for men and women displayed as incidence rate ratios (IRR) from negative binomial generalized linear models of the number of days having 5+ drinks from 6 National Alcohol Surveys. Reference groups are the 41–50 age group, the 2005 survey and the 1955 to 1960 birth cohort. Dotted lines represent estimated 95% confidence intervals.

