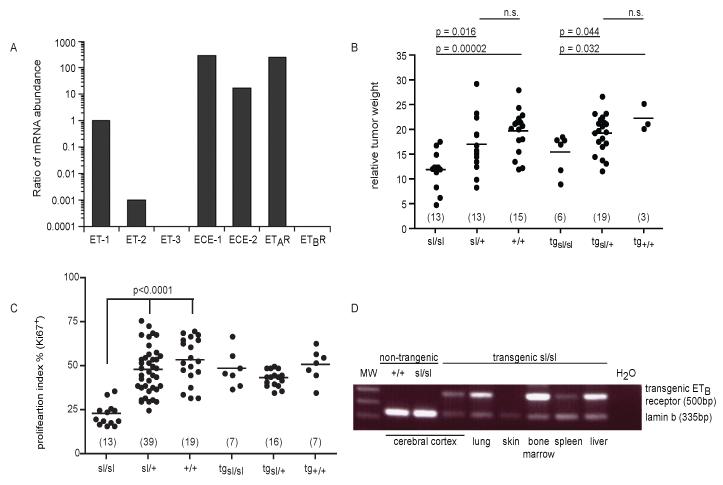
Fig. 1. Expression of the ET system and local tumor growth.
A) RNA expression profile of ETs, receptors and related proteins in MAT B III cells (real-time RT-PCR, one representative of three independent experiments). B) ETBR-deficiency reduces tumor growth. Relative weight of the MAT B III-induced tumors at the inoculation site (normalized to body weight) in the three genotypes of sl rats and their transgenic counterparts. Only litters of similar age (4 in both groups) were analyzed. The animal numbers per genotype are given in brackets. C) ETBR-deficiency reduces proliferation. Proliferation index (% of tumor cell nuclei staining positive for Ki67) in the local tumors. Numbers (in brackets) are higher as for tumor weight, as all inoculated animals were included (6 litters). D) RNA expression of transgenic ETBR in various tissues of transgenic rescue sl rats (RT-PCR, lamin b expression used as control). Primers recognize exclusively the transgenic receptor, not the endogenous form.

