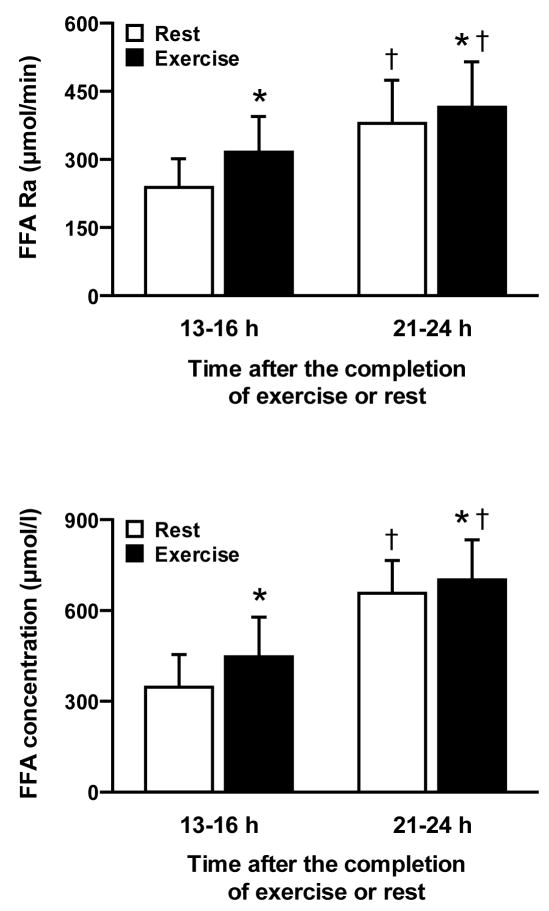
FIGURE 1.
Free fatty acid (FFA) rate of appearance (Ra) (top) and FFA concentration (bottom) in plasma 13–16 h and 21–24 h after a single bout of exercise or an equivalent period of rest. Values are means ± SD. *Value after exercise is significantly different from time-matched value after rest (P < 0.015), †Value at 21–24 h is significantly different from trial-matched value at 13–16 h (P < 0.001).

